World Hostility Graph
- Year
- 2023
- Context
- Challenge
- Role
- Analyst, Designer, Developer
- Tools
- D3.js, HTML, CSS, Python

01 — Premise
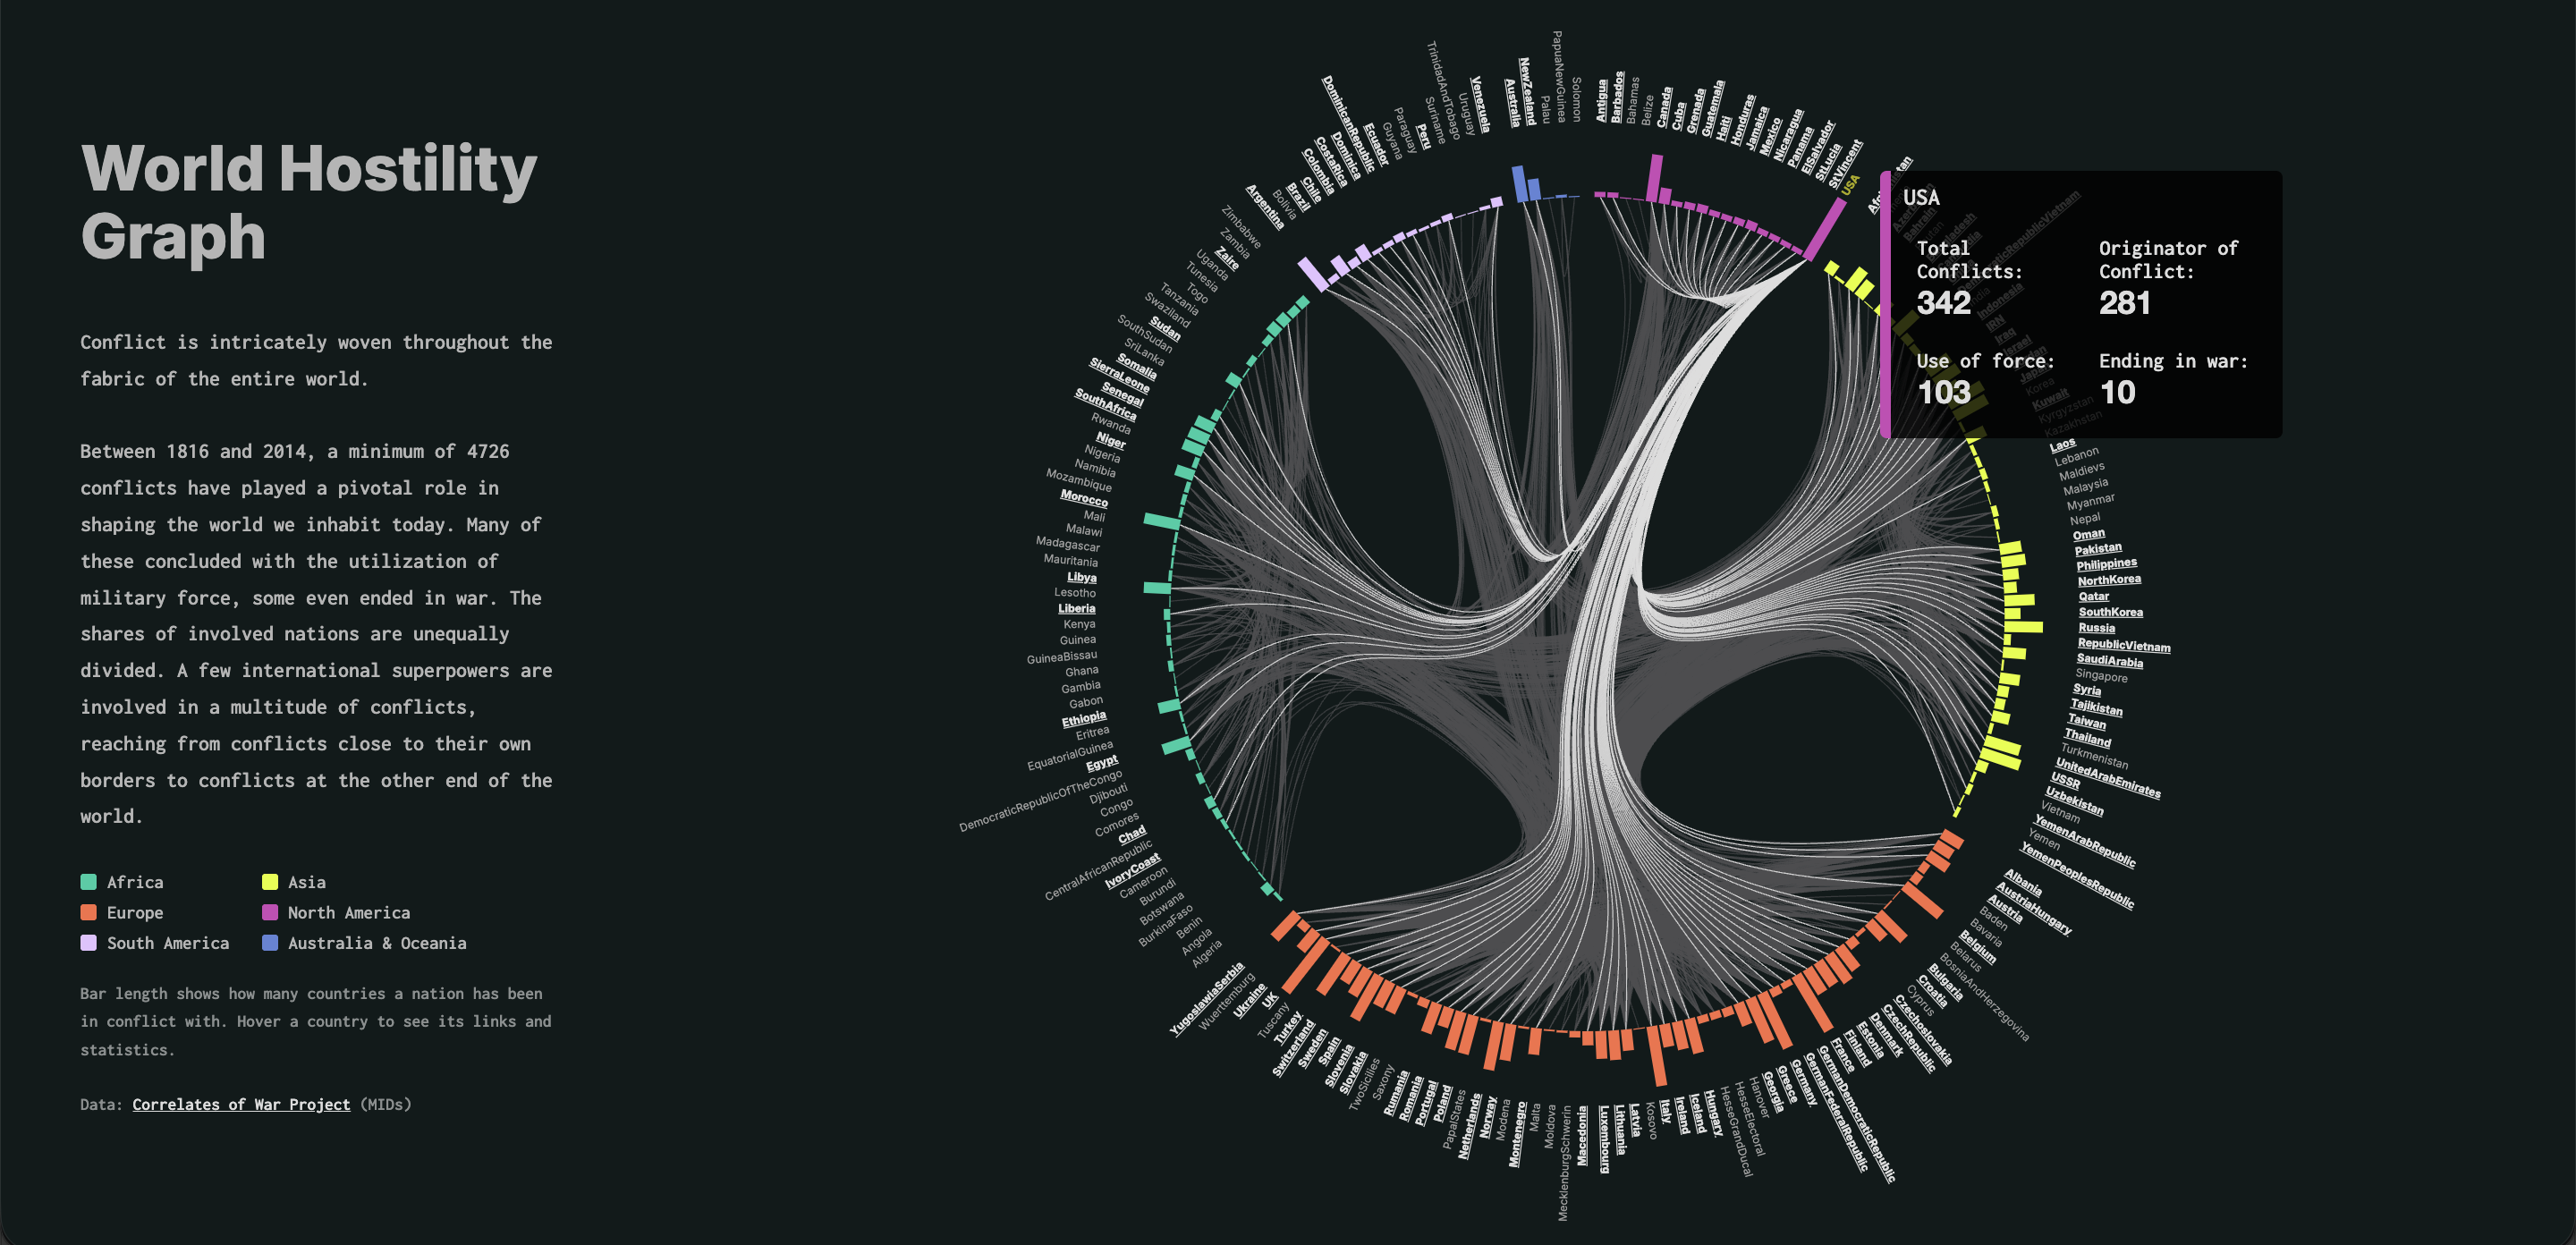
The World Hostility Graph displays the totality of the world's recorded conflicts from 1816 to 2014. In 198 years, 199 countries created 4726 conflicts whose outcomes created our modern world.
The work emphasizes the complex network of conflicts and the exploration of clusters.
02 — Analysis
The dataset is mostly used in political science and has rarely been visualized, so the project began with a lot of experimentation. One key question was the level of detail. I tested views ranging from single incidents to whole countries before choosing a hierarchical edge bundling graph, where bar length shows how many countries a nation has been in conflict with. The hardest challenge was combining this dense network with two centuries of time data without overwhelming the reader. Another was the dataset’s hostility scale, which runs from threats and displays of force up to actual war. These are distinctions most readers aren’t familiar with, so they needed to be made understandable at a glance.
Before the encoding and digital visualization was created a lot of sketching, visual thinking and ideation happened:
03 — Result
After many sketches and iterations, the final piece is the World Hostility Graph, an interactive hierarchical edge bundling graph covering almost two centuries of interstate conflict. Countries are arranged in a circle, and bundled edges connect every pair of states that have been in a dispute. Bars around the circle show how many countries each nation has clashed with, making it clear at a glance that a few superpowers are involved in a large share of all conflicts. Hovering over a country isolates its connections and shows its key statistics, so readers can move from the global pattern to a single nation’s history. The result turns an academic dataset into an accessible, explorable overview of world conflict.
The world hostility graph was longlisted for the Information is Beautiful Awards 2023.