Neurechts in Daten
- Year
- 2019
- Context
- Project work
- Role
- Data Mining, Visualization Design & Development
- Tools
- Python, Plotly.js, React
01 — Premise
Neu-Rechts in Daten is an interactive data visualization project about the German-speaking New Right on Twitter. The movement has only a few tens of thousands of sympathizers, but its coordinated online activism shapes political debate well beyond its size. To make that visible, we analyzed about 540,000 tweets from 800 accounts in the scene and compared them with an equally sized neutral group. The resulting website lets readers explore the network themselves and draw their own conclusions. It captures the scene at its most visible, from late 2019 to early 2020, just before Twitter deleted many of its central accounts.
02 — Analysis
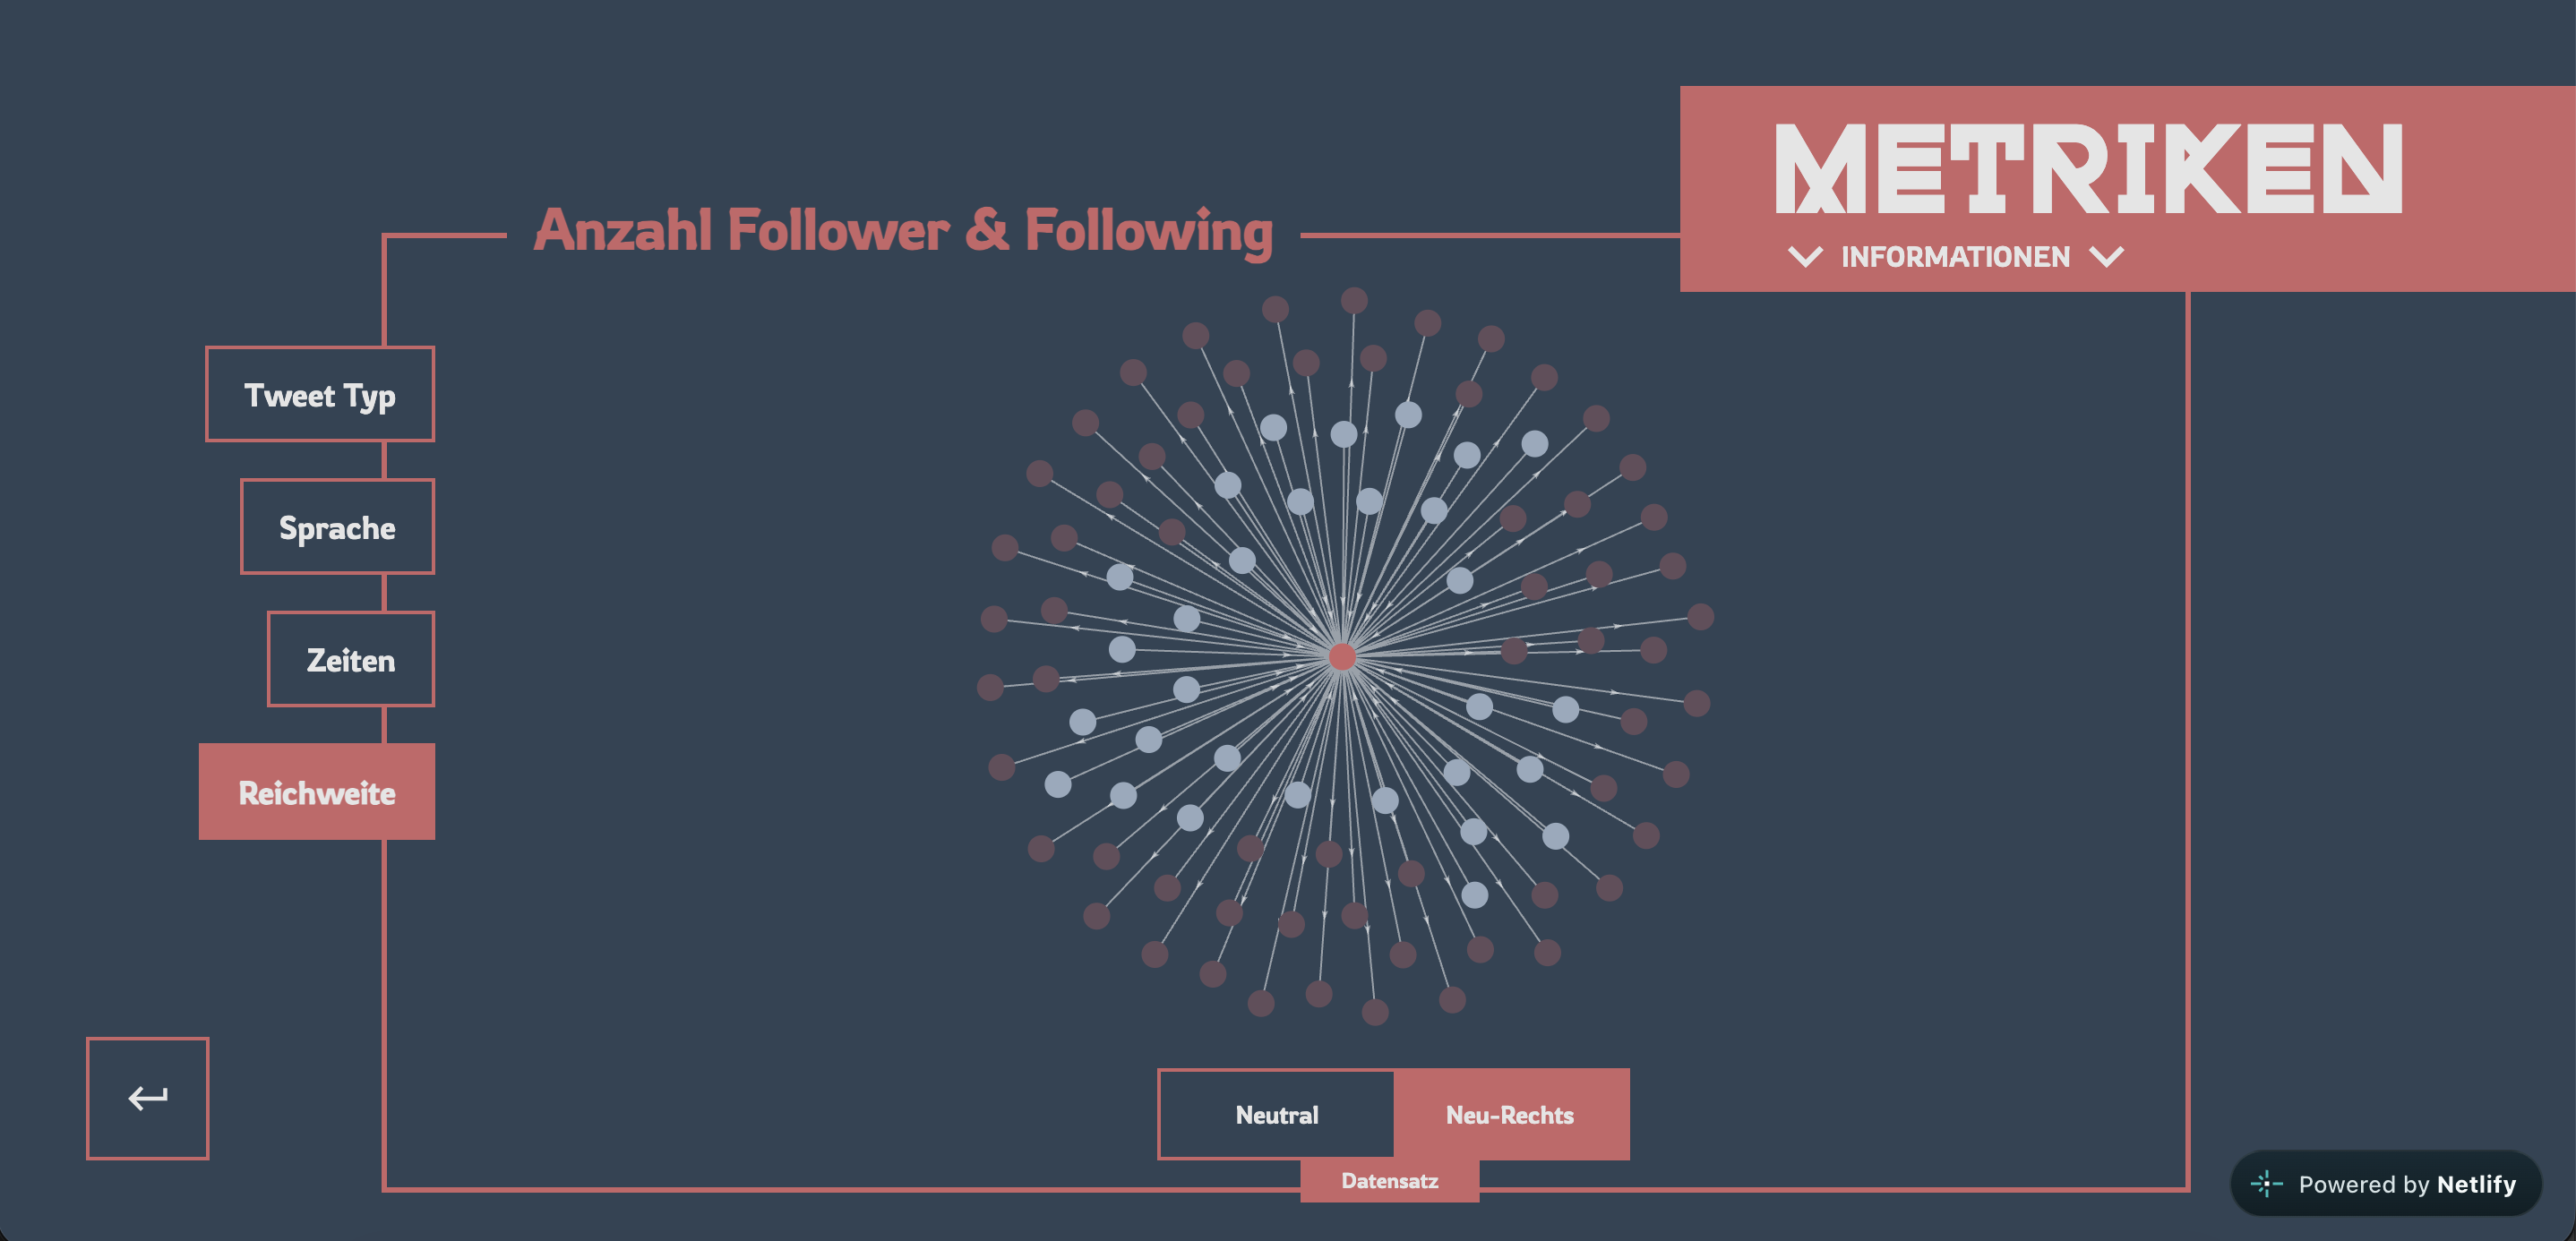
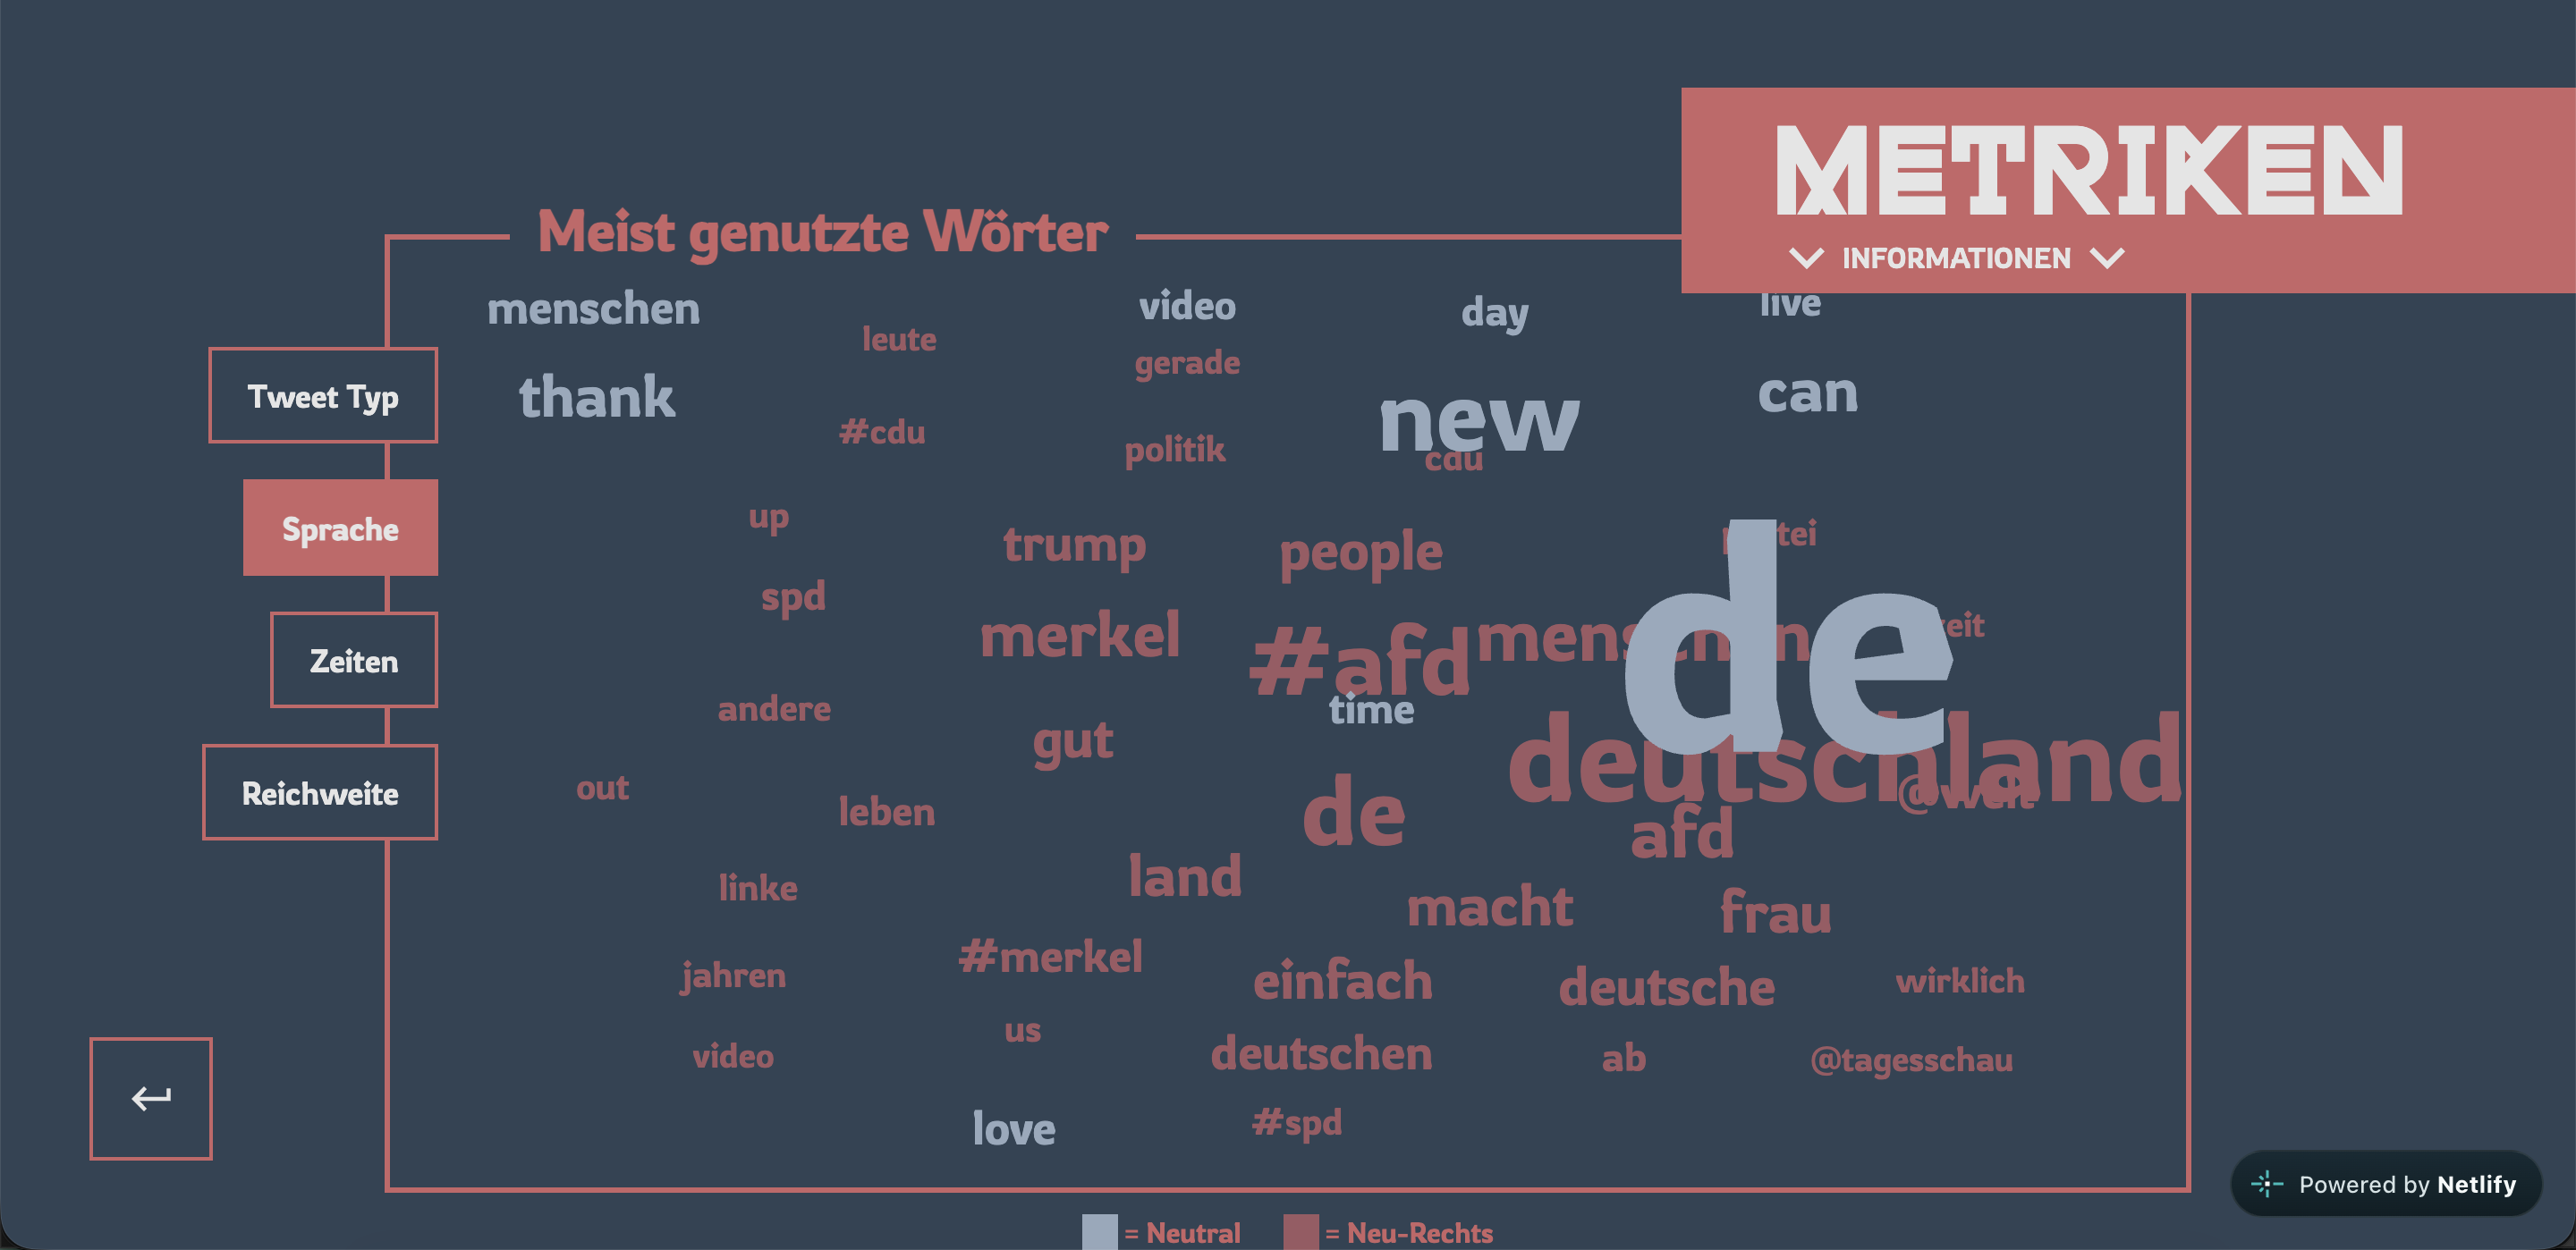
We manually selected ten central accounts of the New Right, including key activists, publishers and magazines, and used the Twitter API to collect their more than 100,000 unique followers. A stratified random sample drew equal numbers from each account’s followers, giving 800 accounts for the analysis. A neutral comparison group of the same size was built the same way from ten mainstream accounts in news, politics, entertainment and sport. For every account, we collected up to its 3,200 most recent tweets, about one million in total. We then compared the two groups by tweet type, word frequency, time of day, follower ratios and who interacts with whom.
03 — Result
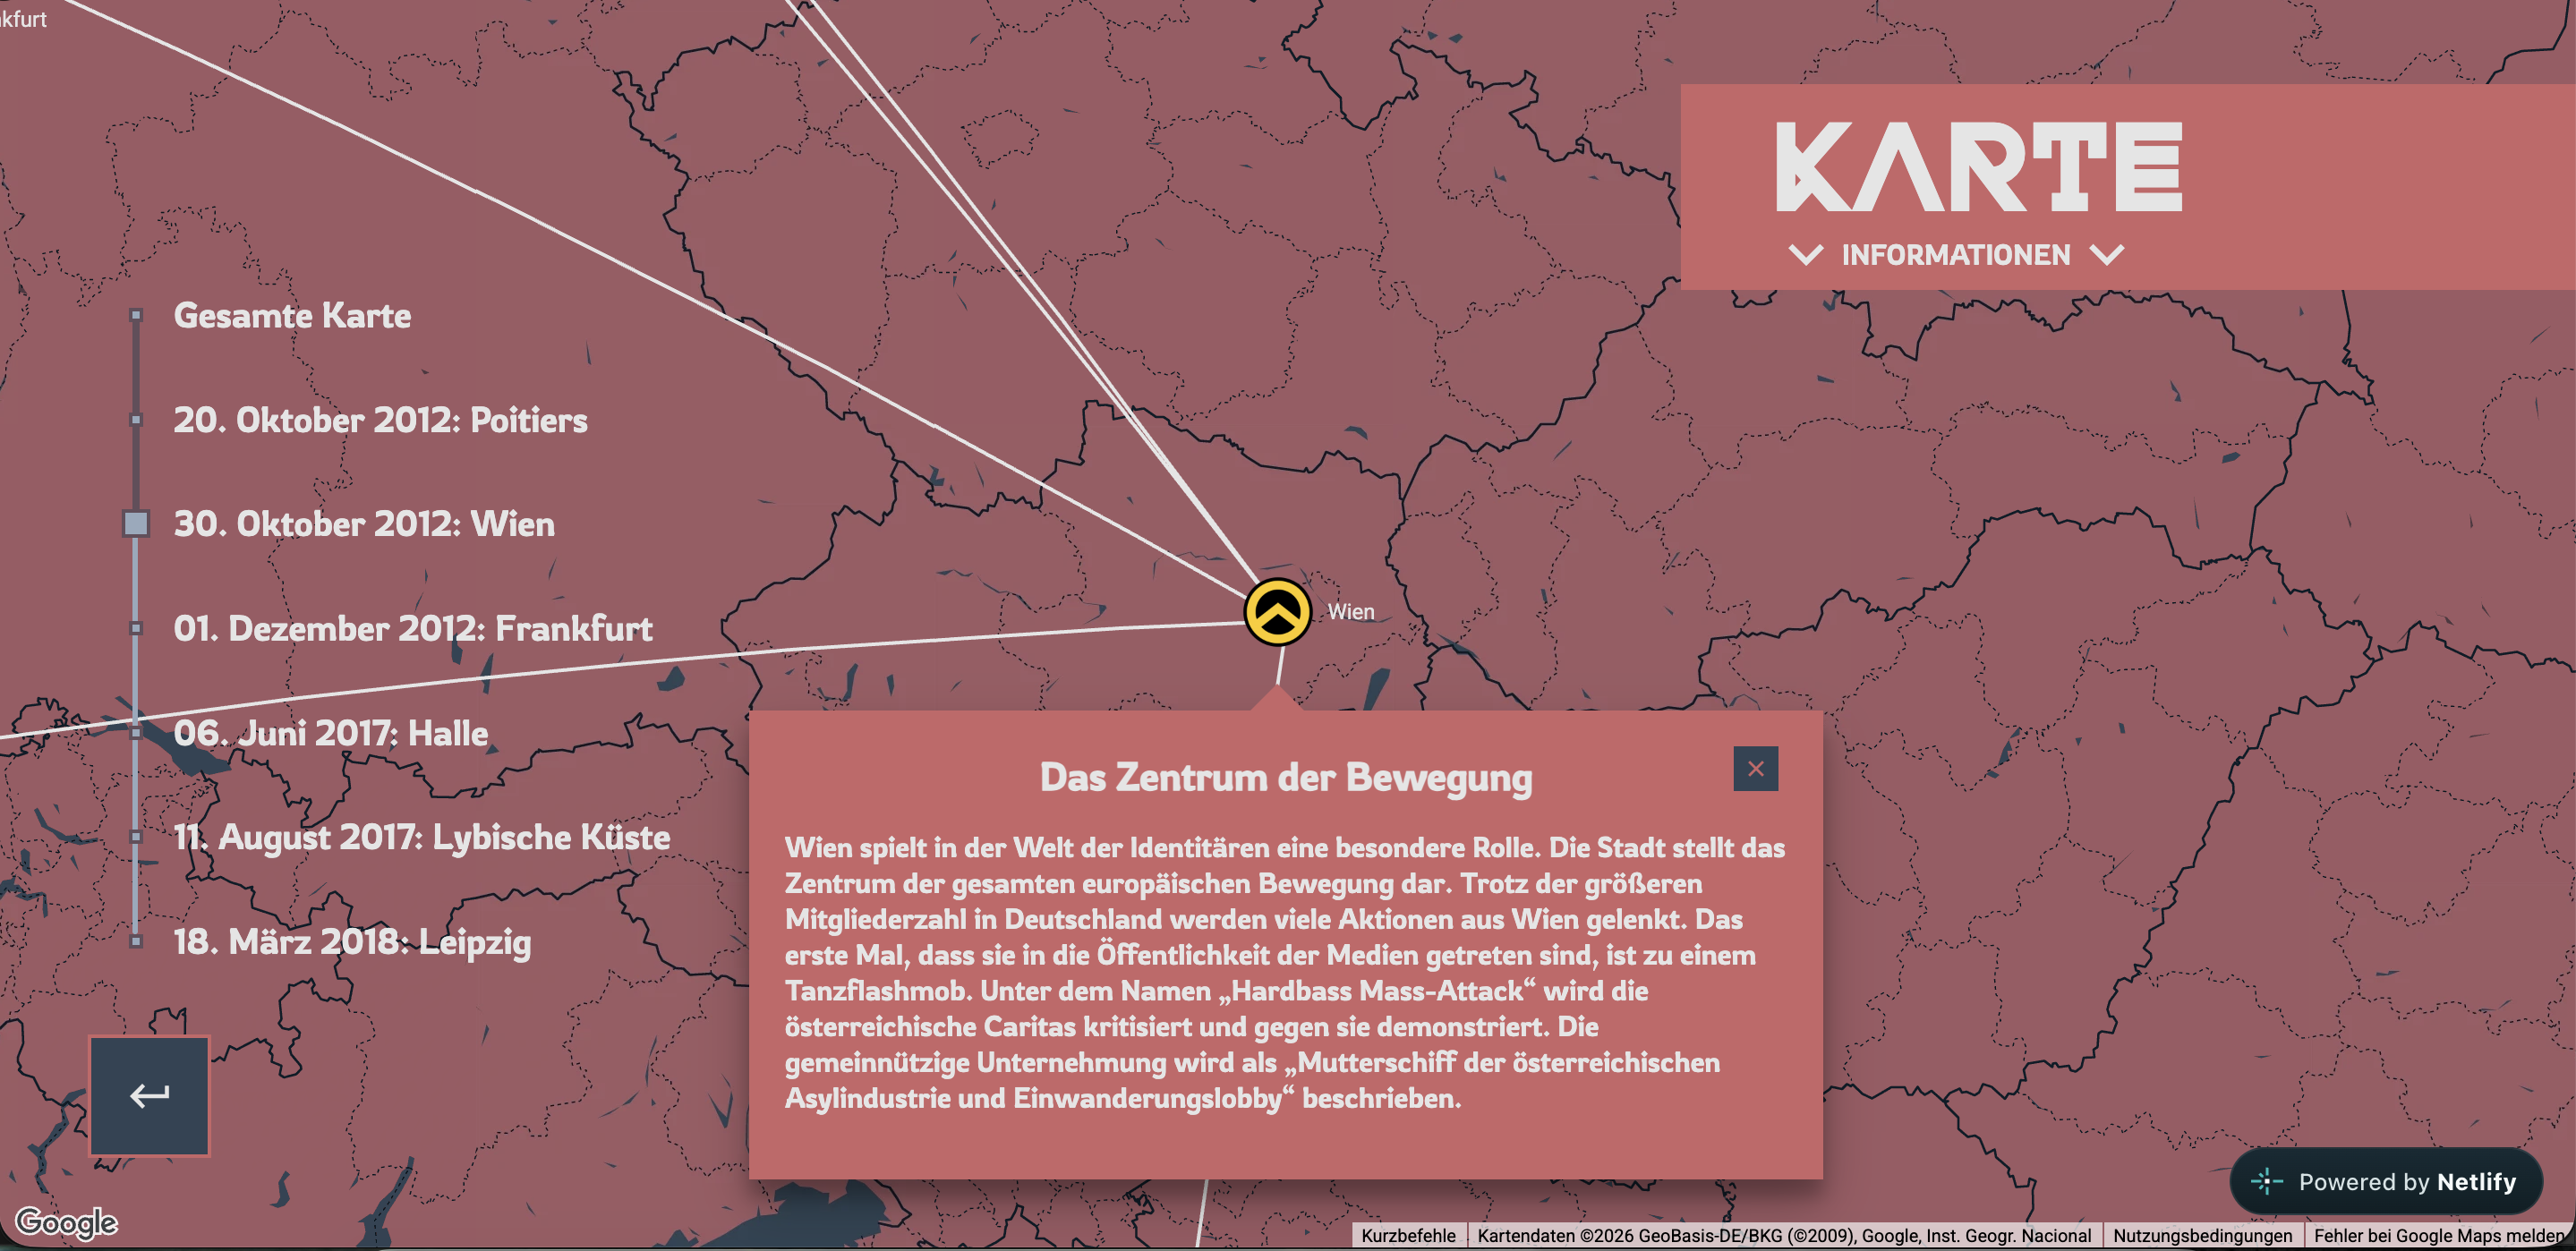
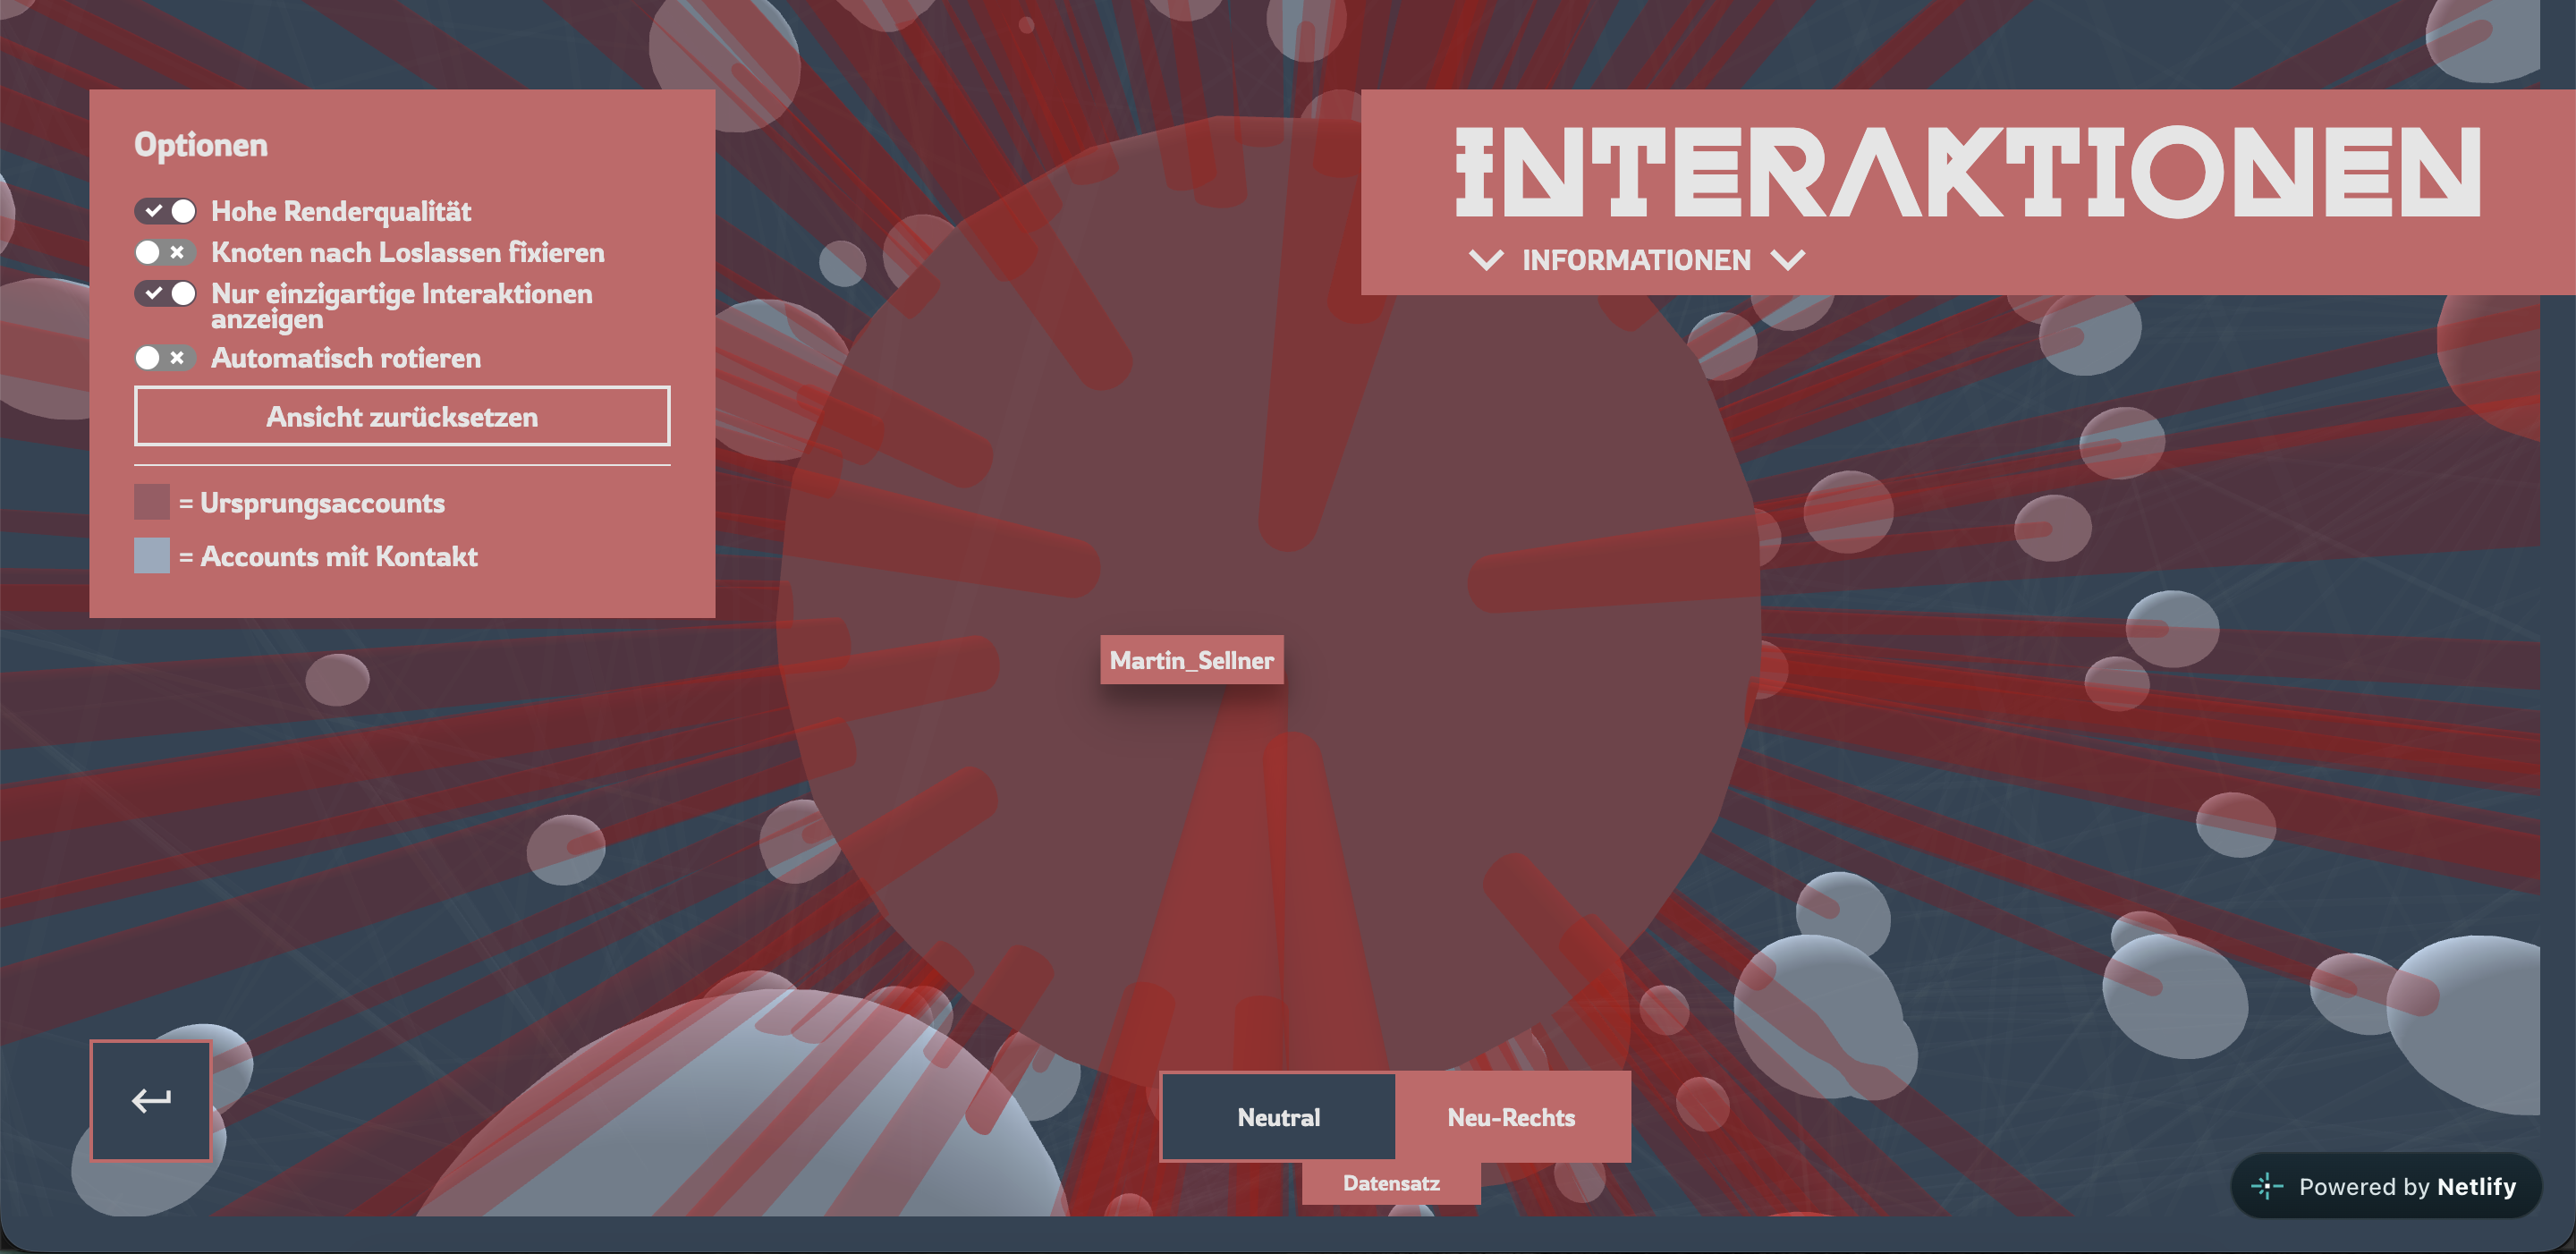
Muted blues, greys and reds were chosen to avoid any political association, while angular shapes and typefaces reflect the uncomfortable subject. Interaction is central: readers can explore 3D tweet plots and network graphs, highlight connections between users, and switch between the New Right and neutral datasets to draw their own comparisons.
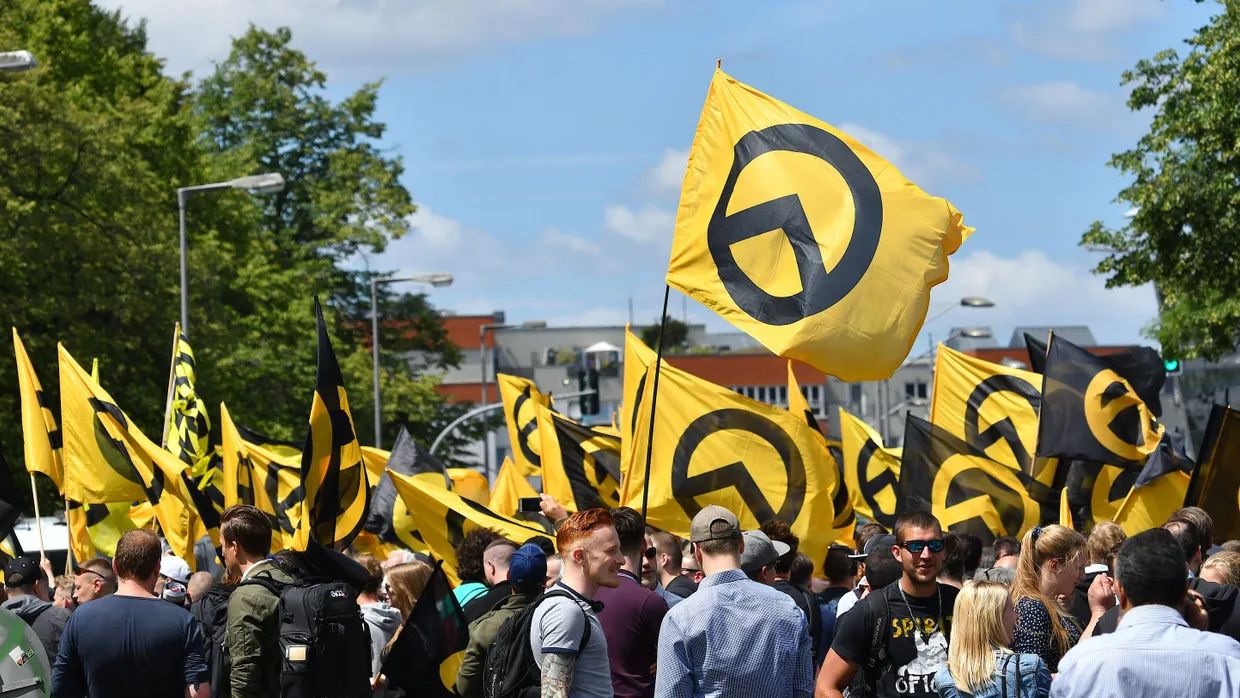
In Germany, the Identitarian Movement has been classified as a confirmed right-wing extremist organisation by the Federal Office for the Protection of the Constitution since 2019.
The project later served as a case study in data journalism and led to a lecture on data mining, analysis and visualization.