Overtourism in Palau
- Year
- 2026
- Context
- Challenge
- Role
- Developer, Designer & Data Analyst
- Tools
- d3.js, Svelte, Python
01 — Premise
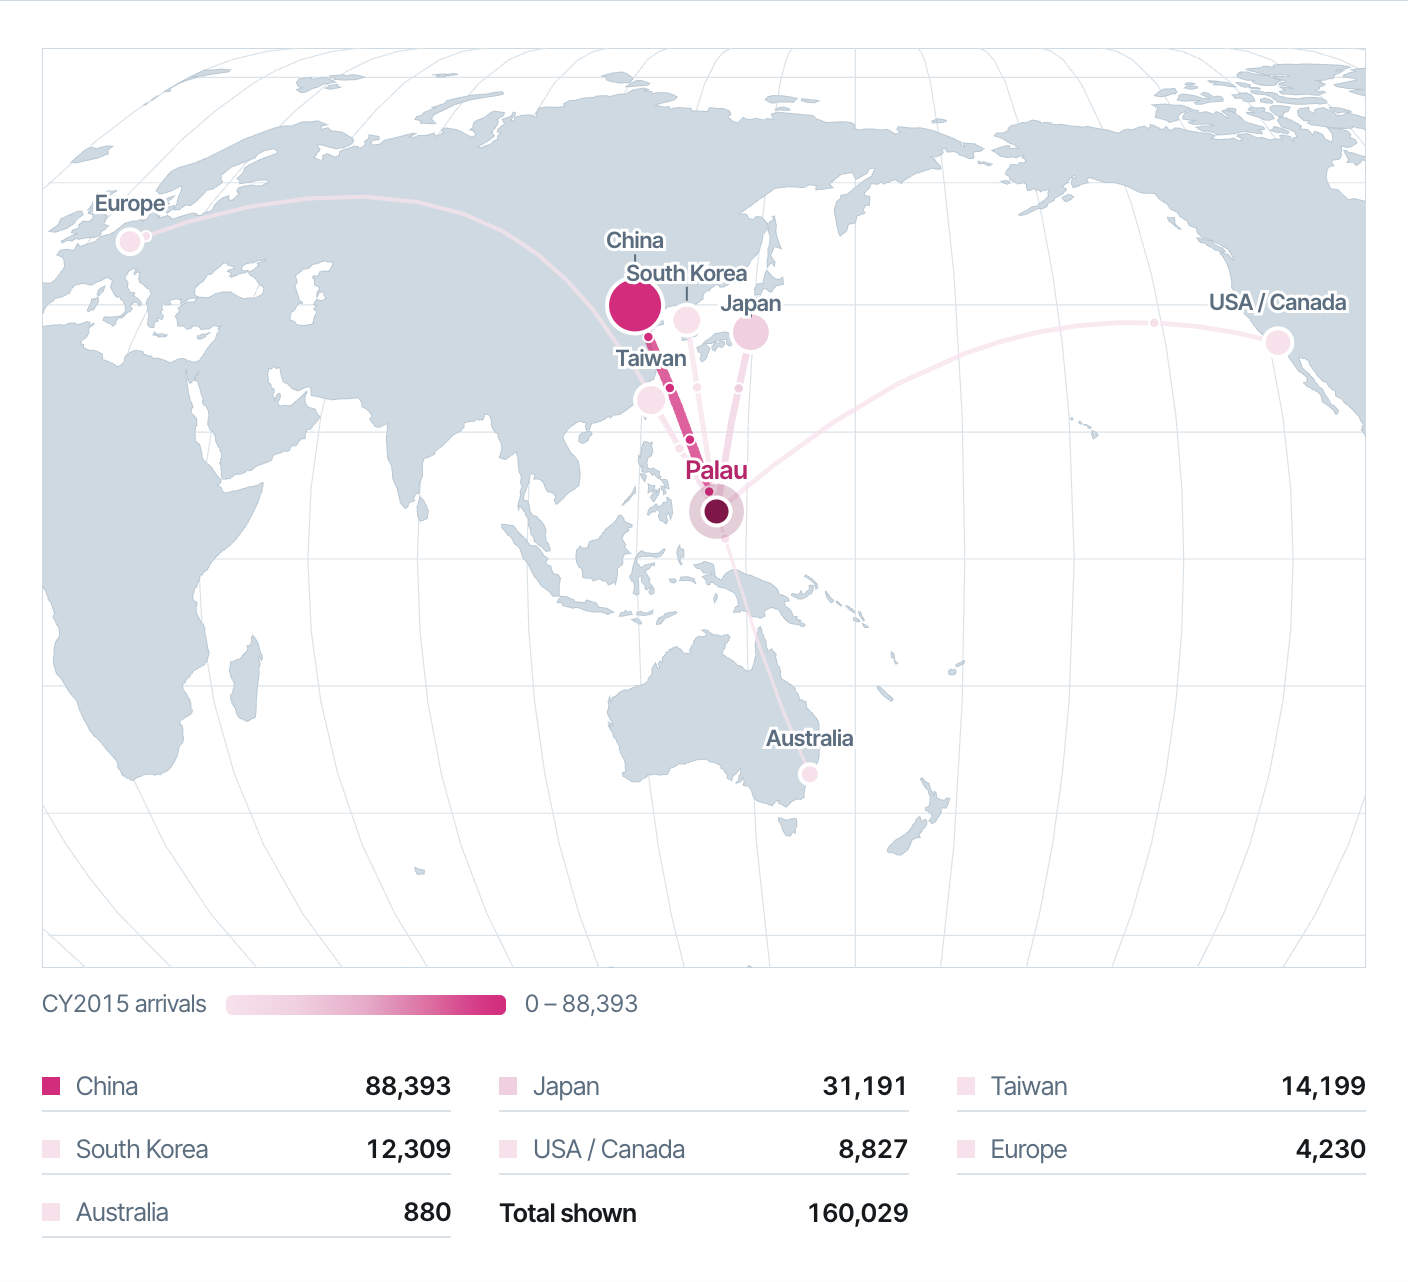
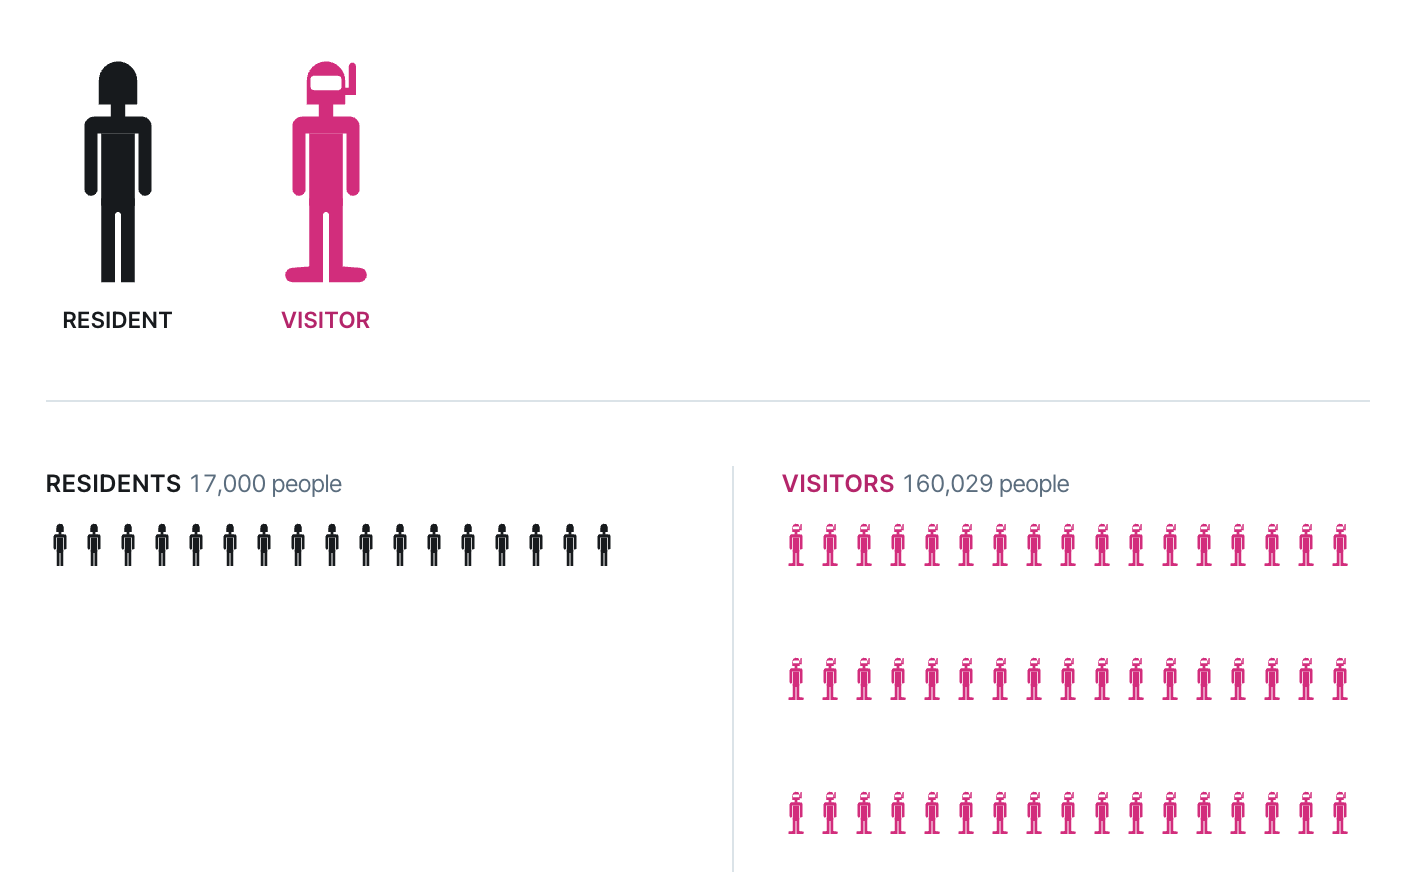
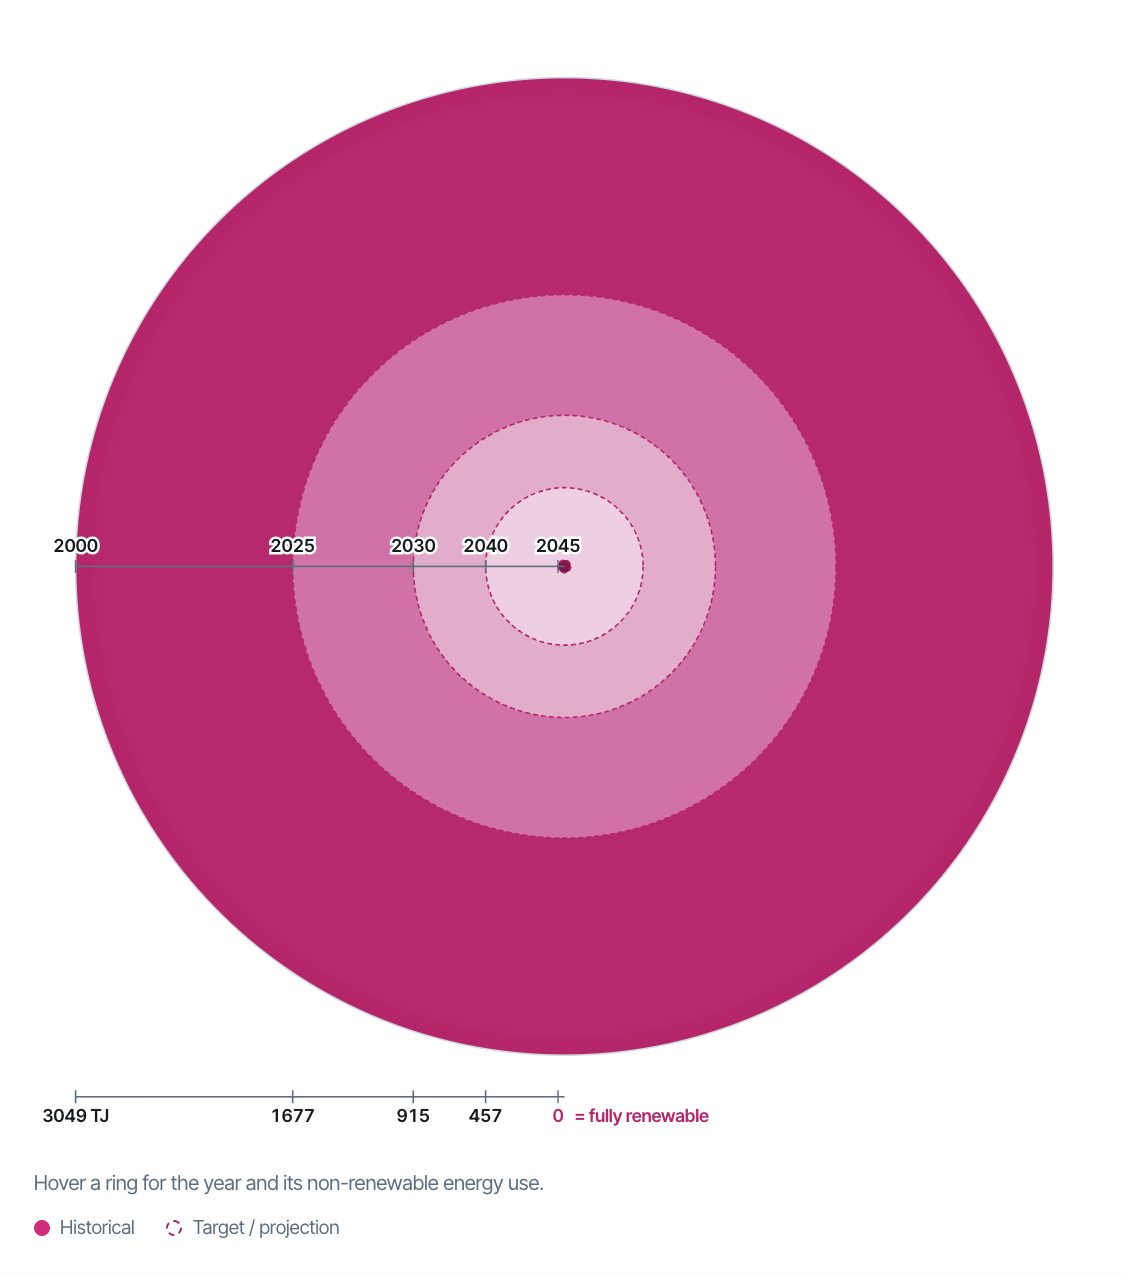
Overtourism in Palau is a scrolling data story created for the Pacific Dataviz Challenge 2026, whose theme this year was climate change. Palau is a Pacific island nation of fewer than 20,000 people that depends on tourism, with visitors at times outnumbering residents nine to one. Nearly all of them come for the reefs and Rock Islands. The project shows the contradiction behind this: the country sells an unspoiled natural image, but its hotels, desalination and dive boats run on a grid that is over 99% fossil fuel. Using open data from the Pacific Data Hub, the story follows Palau from tourism dependence to its ambitious goal of 100% renewable energy and asks whether it can keep selling its beauty without using it up.
02 — Analysis
The project started with an open-ended exploration of several climate change datasets from the SPC Pacific Data Hub, the official data source of the challenge. Comparing countries across indicators, one result stood out: Palau’s greenhouse gas emissions per capita are several times higher than those of any other Pacific country or territory. That outlier became the starting point of the story. Further indicators, such as tourist arrivals and the renewable energy share, helped explain it. To fill gaps in the official data, I added visitor statistics from the Palau Bureau of Budget & Planning and energy figures and targets from IRENA’s Palau Renewable Energy Roadmap. In total, seven data sources were combined into one coherent narrative: from tourism dependence, through a fossil-fuel energy system, to Palau’s path toward renewables.

03 — Result
The piece was published by the Pacific Community (SPC) and the Pacific Data Hub as part of the Pacific Data Viz Challenge 2026.