MuMeVis - Explorative Metabolomics Visualization
- Year
- 2023
- Context
- Research
- Role
- Researcher, Developer & Designer
- Tools
- d3.js, Python, MS2Deepscore, MS2Query, Tableau
01 — Premise
Metabolomics studies all the small-molecule metabolites in a biological system. A metabolic profile reflects genetics, lifestyle, environment, diet and microbiota. It links genotype and phenotype, which makes it valuable for precision medicine, agricultural science and clinical diagnosis. Yet at the end of a long analysis pipeline, identifying the individual metabolites remains a slow, largely manual bottleneck.
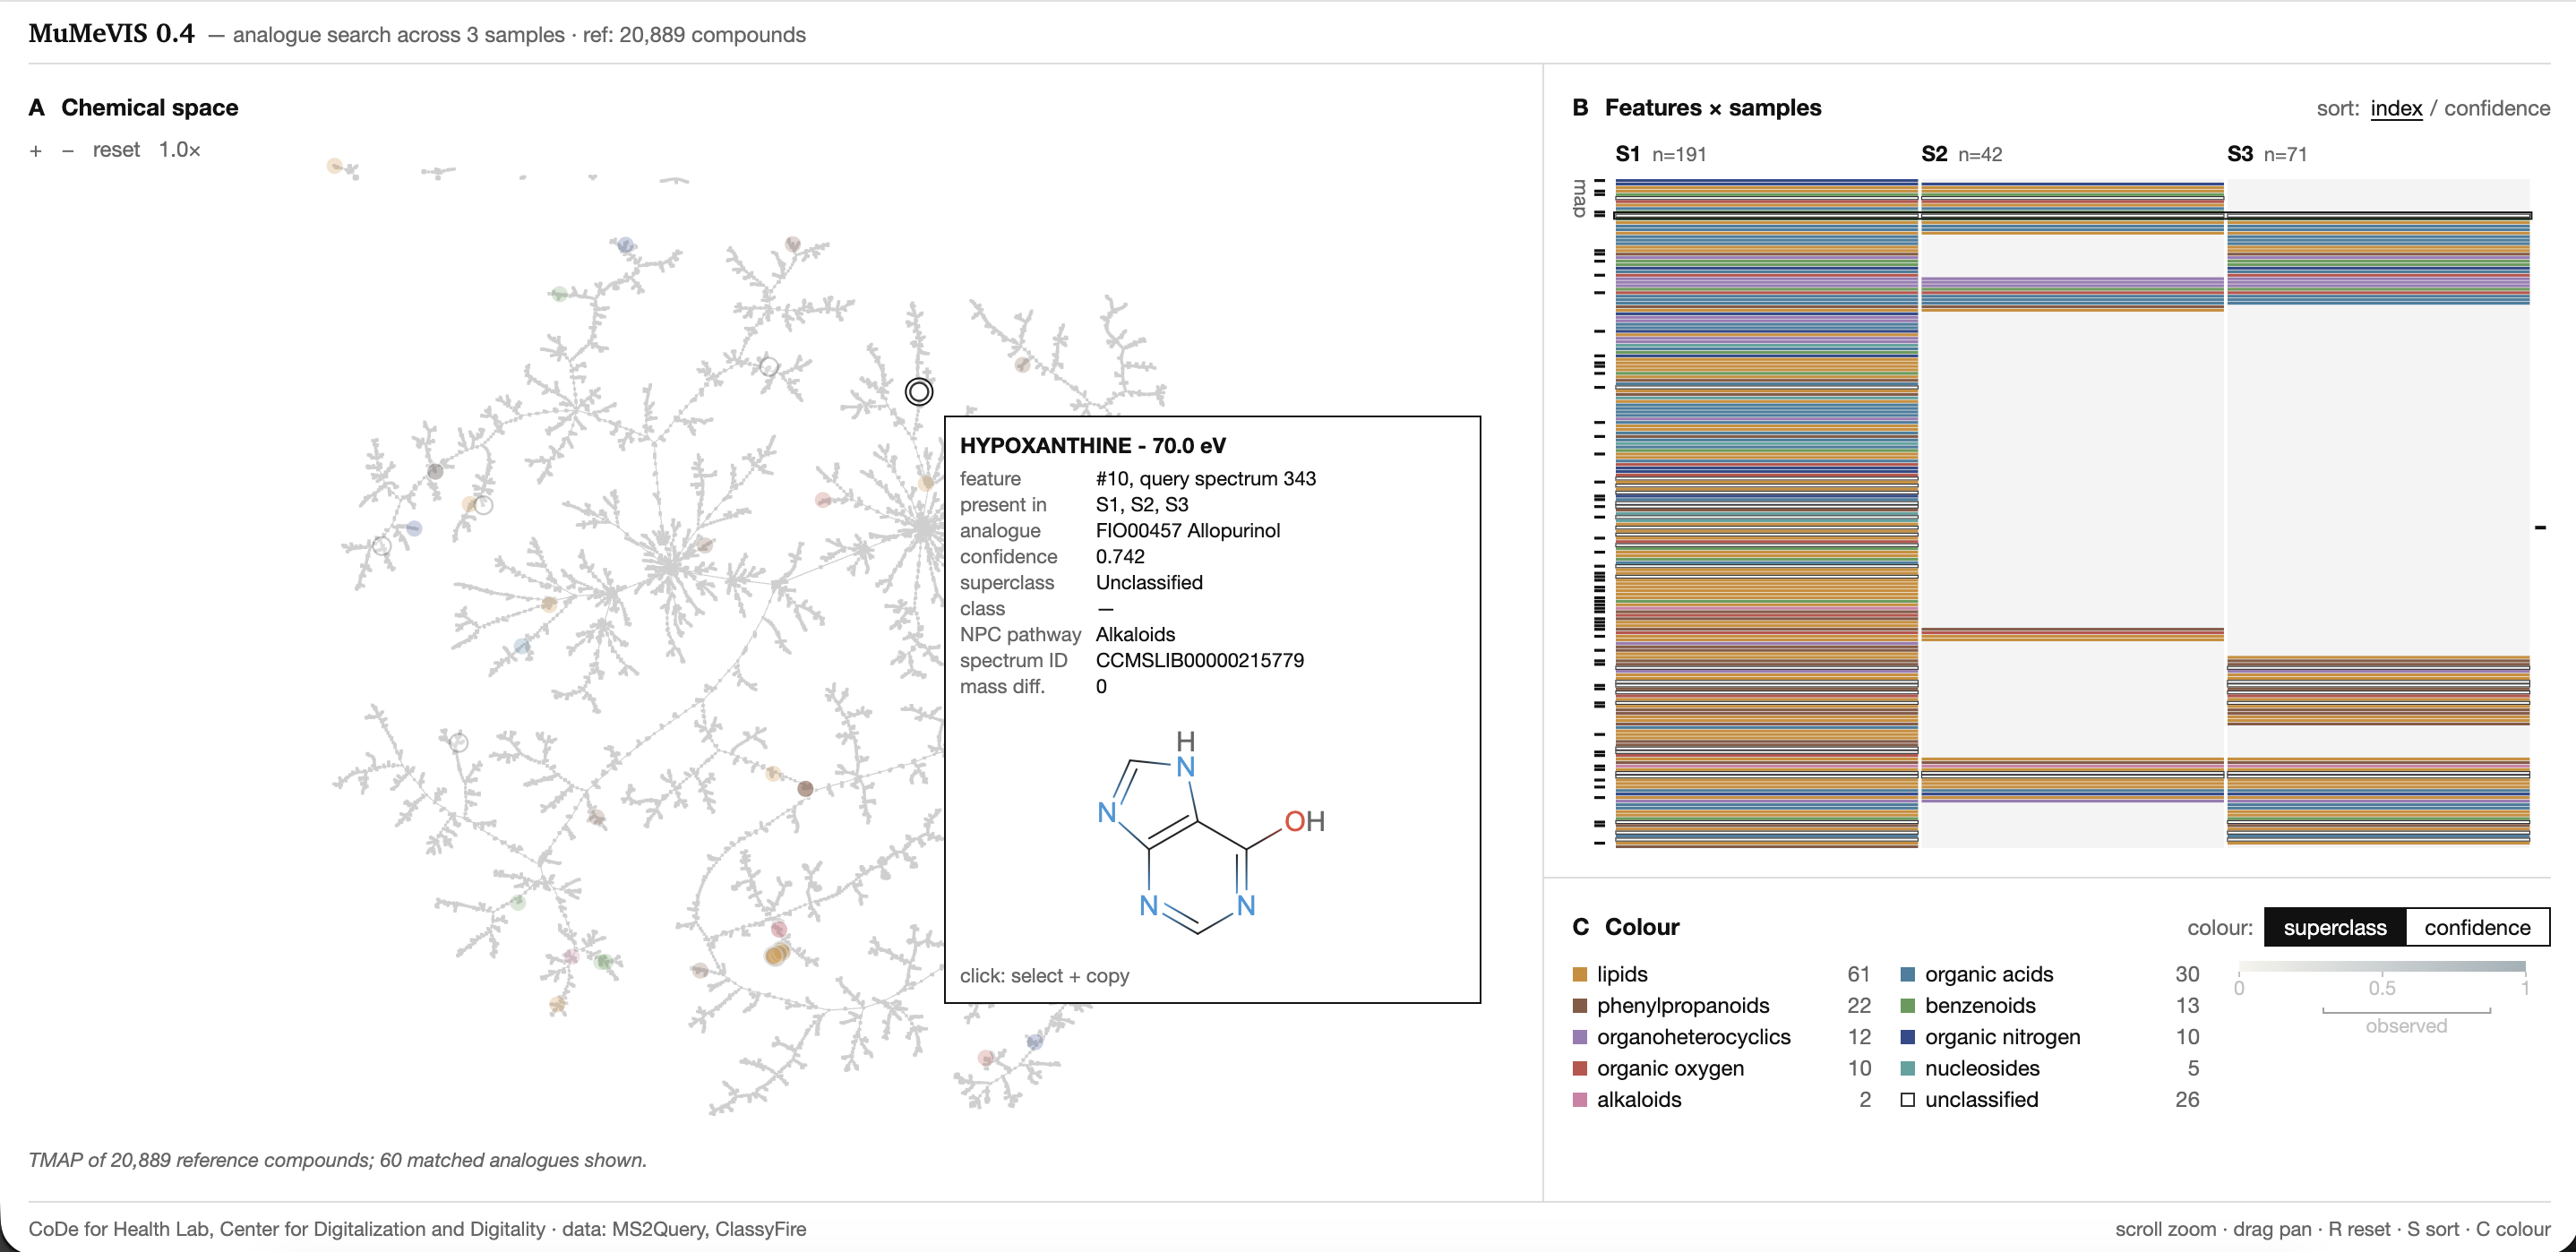
MuMeVis is a prototype that helps experts explore these complex datasets and spot the metabolites worth a closer look. Developed together with domain experts following Munzner's nested model, it combines a TMAP of chemical space with a feature-by-sample matrix in one multi-view system, built in d3.js and evaluated qualitatively in user tests with experts.
02 — Analysis
From raw spectra to something you can see
Before designing anything, I needed to understand what the data actually is. The tool is built on the output of MS2Query, a machine-learning library that takes the spectrum of an unknown molecule and finds the closest known compound, its analogue, in a reference library. MS2Query combines five signals to estimate how chemically similar two compounds are: Spec2Vec similarity, precursor mass, mass difference, an averaged MS2DeepScore and a Tanimoto score.
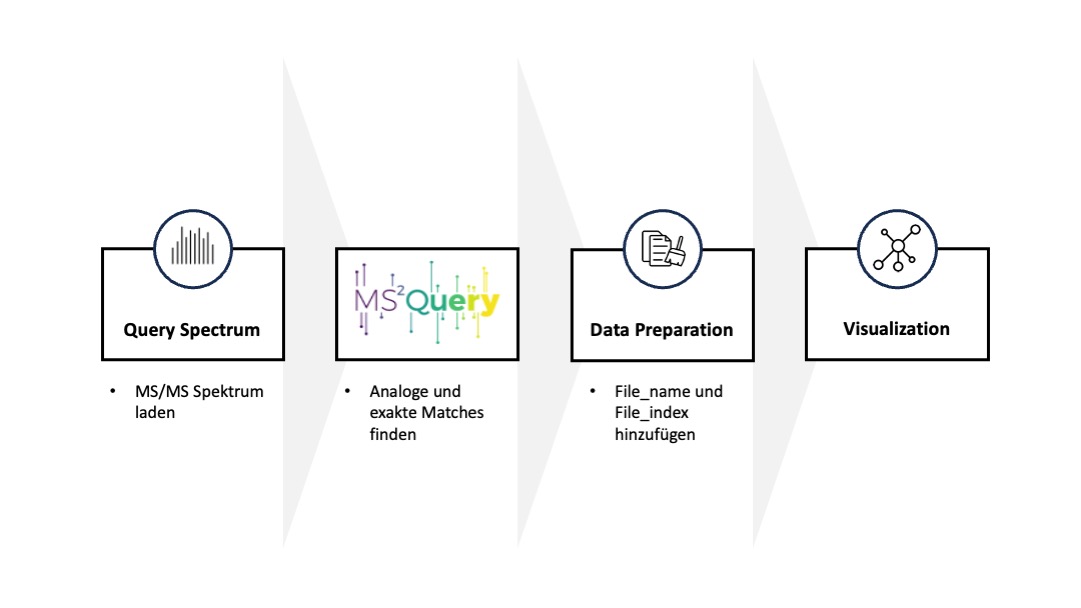
The pipeline above shows how a sample becomes a visualization. Mass spectra go into MS2Query, and each compound comes out as a table row with 25 attributes. I then added a compound index, a file name and a file index, so that several samples can be loaded, told apart and put in order (for example, blood samples taken over several weeks). The result is a single JSON file that the D3.js front end reads directly.
Abstracting the data
The 25 attributes only made sense once I translated them out of chemistry terms. I classified each one as categorical, ordered or quantitative, and recorded its range or number of unique values. That process showed how varied the data is: 182 unique analogue spectra, 9 superclasses, 33 classes and 58 subclasses, and masses ranging from 89 to 1,178 m/z. It also showed where the gaps are. Not every analogue has a structure, a mass or a class, so the design had to handle missing values gracefully.
What experts actually need
Interviews with metabolomics researchers told me which attributes matter most. The query spectrum number is essential because it links each hit back to the raw data. The chemical structure is the most telling single piece of information. Superclasses help you get oriented but are too broad for real research questions.
Defining the task
Using Brehmer and Munzner’s task typology, I defined the core task as exploration: the user doesn’t know what they’re looking for or where it is. The goal is to identify individual compounds worth investigating further. This shaped both views. The TMAP supports selecting, navigating and aggregating compounds against the library. The matrix supports selecting, navigating and sorting them across samples.
03 — Result
Expert feedback showed that a visualization tool is only one building block in a fragmented landscape of tools and workflows, serving very different user groups. Metabolites are best understood in the context of the whole sample. Of the two views, the TMAP proved the stronger one: it communicates on several levels at once, through a metabolite's global position, its neighbourhood and the reference database behind it. Still, the exploratory nature of untargeted metabolomics calls for a multi-view system that combines several methods.
The tests were limited by a small pool of experts, most of them able to code, and by dummy data. Next steps include testing with the experts' own data, adding more matrix sortings, integrating compound metadata and showing the query and analogue spectra side by side. Analysing MS2Query results and analogues across related samples is a largely unexplored approach, and how it compares with established methods such as molecular networking remains open.
View Project ↗ · Project page at CoDe for Health ↗
The project was funded internally by Hochschule Düsseldorf (HSD) and developed in the CoDe for Health Lab at the Center for Digitalization and Digitality Düsseldorf.